
Key Takeaways
- A metric tells you its measured result changed, not what caused the change or whether the outcome was worth the price.
- The signal you optimize around (leads, demos) quietly drifts into a stand-in for the outcome that actually matters (revenue), and reporting stays strong while qualification quietly erodes.
- A falling CPA can mean real efficiency or a drift toward cheaper, lower-value prospects, and the cost metric alone can’t tell you which.
- Your measurement setup is part of the system you’re optimizing: if two unequal lead types are fed in as equal conversions, the platform optimizes toward the wrong one.
- Current average efficiency describes spend already made, not what the next dollar will buy, so match the depth of your scrutiny to the size of the decision.
A metric improves. The platform reports better numbers. The decision that follows feels less certain than the data suggests it should.
At some point, the metric stopped being evidence and became the conclusion, and the question of what it represented got skipped. A better CPA, a rising conversion rate, and a stronger ROAS: each can reflect genuine improvement. Each can also reflect changes in the mix of outcomes being acquired, the people responding, or the way those outcomes are measured. The metric alone may not distinguish between those explanations. Interpreting the difference is the job.
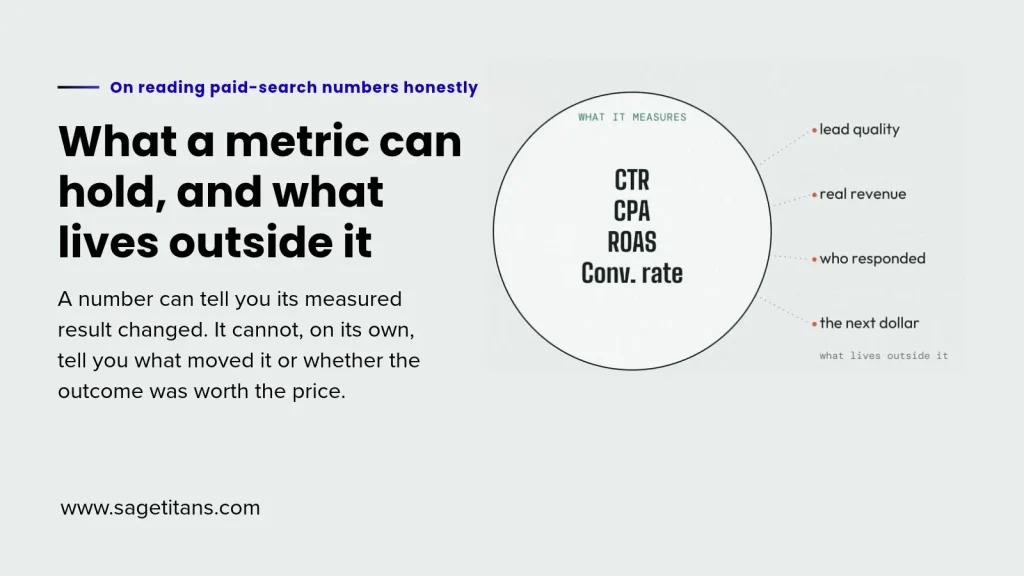
CTR, CPA, ROAS, and conversion rate: if you’re reading this, you know what these measure. The more useful question is what they can fail to establish when they move.
The outcome that matters most may not be the best signal to optimize around
The measure that best defines whether PPC succeeded and the signal most useful for day-to-day optimization don’t have to be identical. They often aren’t, and treating them as though they are creates problems that can remain invisible in platform reporting until pipeline or revenue data tells a different story.
A business outcome, such as closed revenue, qualified pipeline, or retained customer value, is often a clearer indication of whether a campaign contributed to business objectives than the platform metrics used to run it. But it may arrive too infrequently, or with enough conversion delay, to serve as the sole operational optimization signal. So an earlier event gets used instead: a lead, a demo request, or a booking. That’s a reasonable and often necessary decision.
The problem isn’t using a proxy. It’s what happens to the proxy over time. Teams don’t set out to treat leads as more important than revenue. But the optimization system runs on leads. The dashboard reports leads. The weekly meeting discusses leads because that’s the number available when the meeting happens. Gradually, lead volume starts functioning as a substitute for the outcome it was meant to represent.
That doesn’t mean every proxy needs to mirror the final business outcome precisely. The practical question is whether the relationship between the proxy and that outcome remains stable enough for the decisions being made. A lead can be a useful optimization signal even when not every lead becomes revenue. The problem is when that relationship shifts, and the team continues interpreting the same lead metric as though nothing underneath it has changed.
When that relationship shifts, reporting can still look strong even if qualification rates deteriorate or revenue performance tells a different story.
When a metric improves, ask what changed underneath it
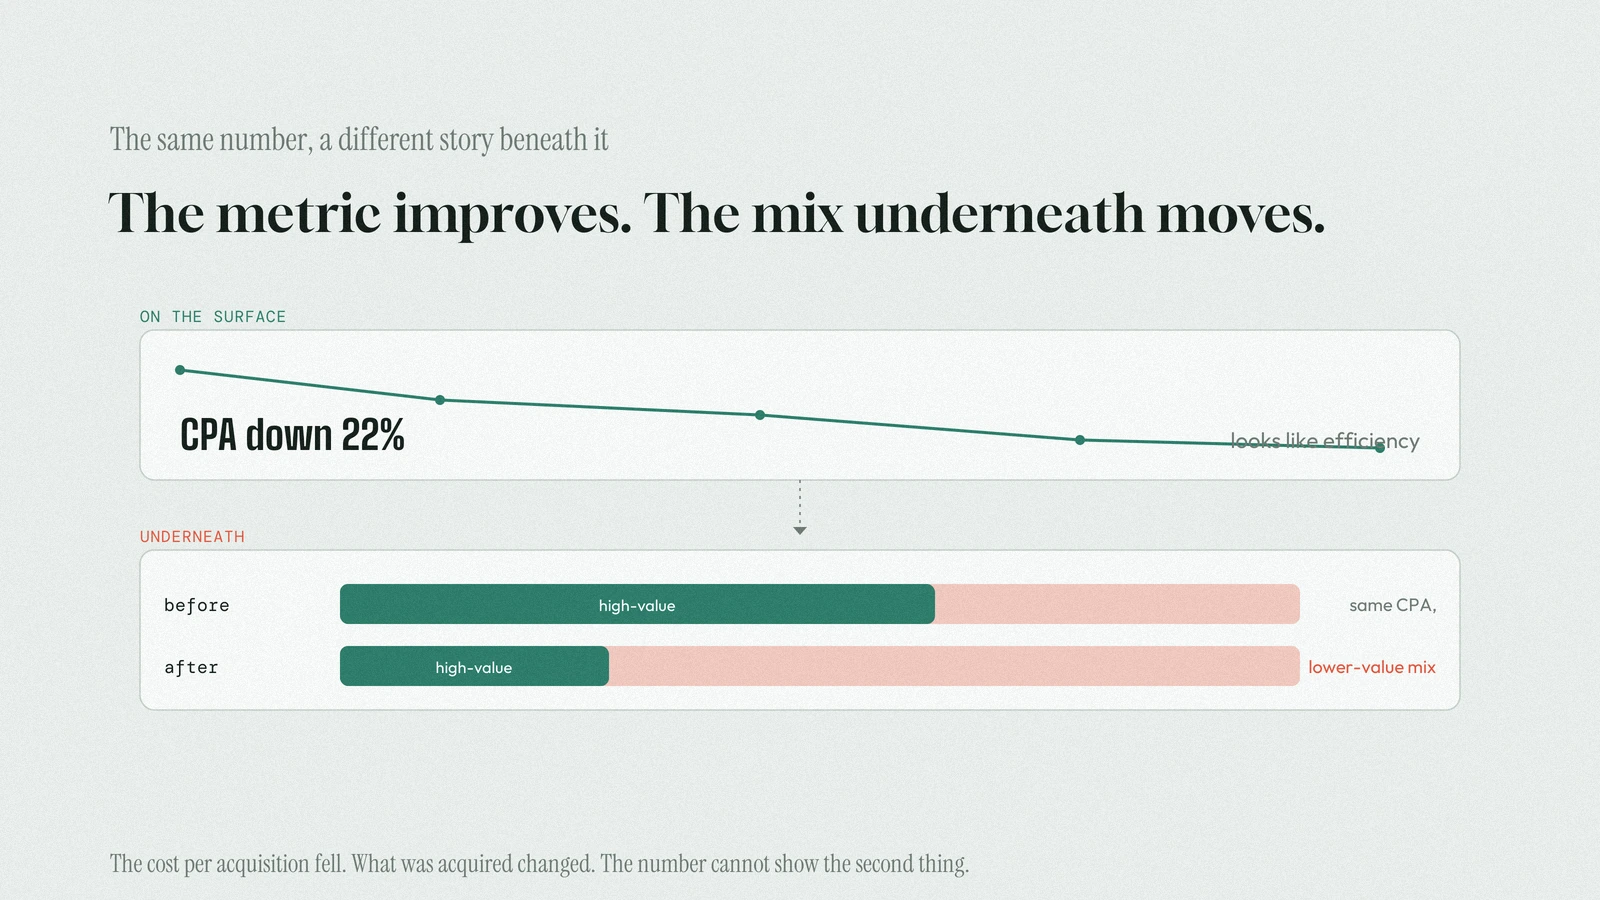
A metric tells you that its measured result changed. It doesn’t tell you what caused the change, whether the composition of what is being acquired shifted, or whether the value of those outcomes held.
A lead generation campaign reduces form friction. Conversion rate may rise, and CPA may fall. Both are genuine improvements in the measured conversion rate and cost per acquisition. Whether those leads qualify, progress through the pipeline, and convert to revenue at a comparable rate or whether lighter friction attracted a different audience that performs well at the point of conversion and deteriorates below it is a separate question those same metrics can’t answer.
CTR and conversion rate carry different limitations here. A rising conversion rate tells you that, relative to the denominator defined by the measurement setup, a greater share resulted in the tracked action. A rising CTR tells you that a greater share of impressions generated clicks, but click volume and click quality aren’t the same measurement, and CTR, considered alone, carries limited information about what that traffic will do further along the conversion path. It can be consistent with a more compelling message or a better fit between the ad and the audience. It can also reflect changes in targeting, traffic mix, or a message that generates more clicks without improving commercial outcomes at the point where they matter. Used as evidence of audience quality, CTR says more than the metric itself can justify.
Before a metric movement drives a significant decision, a budget reallocation, a strategic recommendation, or a client-facing conclusion, what specifically changed deserves examination: the audience, the conversion definition, the friction, and the qualification rate. The depth of that examination should scale with the decision it’s meant to support.
Not every movement deserves the same scrutiny. Small fluctuations may reflect noise or normal variation, and over-interpreting them carries its own cost. The point is to match the strength of the evidence to the consequence of the decision: the larger the budget shift, the strategic change, or the performance claim, the less comfortable you should be letting a single metric carry the explanation.
Cost metrics are prices, not verdicts
CPC tells you what you paid for a click. CPA tells you what you paid, on average, for a tracked acquisition or conversion. Neither tells you whether that price was justified by what the event represented.
If the composition of what’s being acquired can shift without surfacing in the top-line metric, then cost per acquisition is only as meaningful as the consistency or value of what’s being acquired. When composition shifts, the price tag changes meaning along with it.
Two campaigns: one produces leads at a lower CPA, the other costs more per lead but converts to revenue at a materially higher rate. “Which campaign is cheaper” and “which campaign is more valuable” are different questions. The cost metric answers the first.
A falling CPA can reflect genuine efficiency or a drift toward easier-to-convert, lower-value prospects that may not register as a problem until the pipeline data catches up. A higher CPA might reflect competition for outcomes that justify the price. Whether the price paid was justified depends on information the cost metric cannot provide on its own: what progressed, at what rate, and toward what return.
Your measurement model is part of the system you’re optimizing
There’s a difference between what happened and what the measurement setup told the optimization system to treat as success. In automated PPC, those can diverge in ways that may not surface in platform reporting until the gap is already wide.
When optimization produces results that diverge from business intent, the system may still be optimizing consistently toward the conversion or value signals and goals it was configured to use.
If two lead types, one that reliably progresses to revenue and one that rarely does, are treated as equivalent conversion signals, the conversion data being supplied does not explicitly communicate that difference in value to the optimization goal. The platform may use many other contextual and predictive signals, but when the conversion data supplied for optimization treats both outcomes as equivalent, the difference in their business value is not explicitly represented in that conversion signal.
Adding qualification data or differentiated conversion values can make the optimization signal more representative of the differences in business value that matter. But that involves trade-offs: more complexity in the measurement infrastructure, greater dependency on data pipelines that may be incomplete, inconsistent, or delayed, and more points of failure between the CRM and the platform. Whether that complexity is justified depends on whether the distinctions being flattened are material enough to affect optimization or decisions. A sophisticated model built on incomplete or inconsistent data may produce a less reliable optimization signal than simpler measurement applied consistently.
Current efficiency doesn’t tell you what the next dollar will do
A campaign’s current ROAS or CPA describes performance under the conditions that produced it. Average performance and the expected performance of additional spend answer different questions, and current average efficiency addresses only the first.
A campaign’s historical average reflects what it returned across the spend already allocated. What an additional increment of budget will produce is a different question, and the campaign’s historical average alone does not establish the answer. The mix of auctions entered can change. Reach can expand into different parts of the available audience. Competitive conditions and placement dynamics can shift. The average efficiency figure was produced across all of that at current levels; it doesn’t translate directly into a forecast for additional spend at higher levels.
This is one reason a campaign can appear highly scalable based on its current results and then perform differently once spend increases. The historical average can serve as a starting point, but increasing spend can change the auction, audience, and inventory conditions under which additional conversions are acquired, and those changes introduce uncertainty that the existing average cannot resolve.
Scaling a well-performing campaign can be entirely justified. Whether the expected return from additional spend still clears the bar is the more direct question at that point. One describes the performance already achieved. The other is an estimate of what additional budget is likely to produce, and the two don’t automatically agree.
Conclusion
Good PPC measurement starts with knowing what each metric can establish and where its limits are and recognizing when the distance between a number improving and a business outcome improving is wide enough to affect a decision.
Problems begin when a metric is asked to carry more than it can show before anyone has examined what outcome it represents, what changed to produce it, and what it doesn’t yet establish. Platform numbers trending in the right direction are evidence that the measured result changed. They aren’t complete evidence of what that change means for the business.
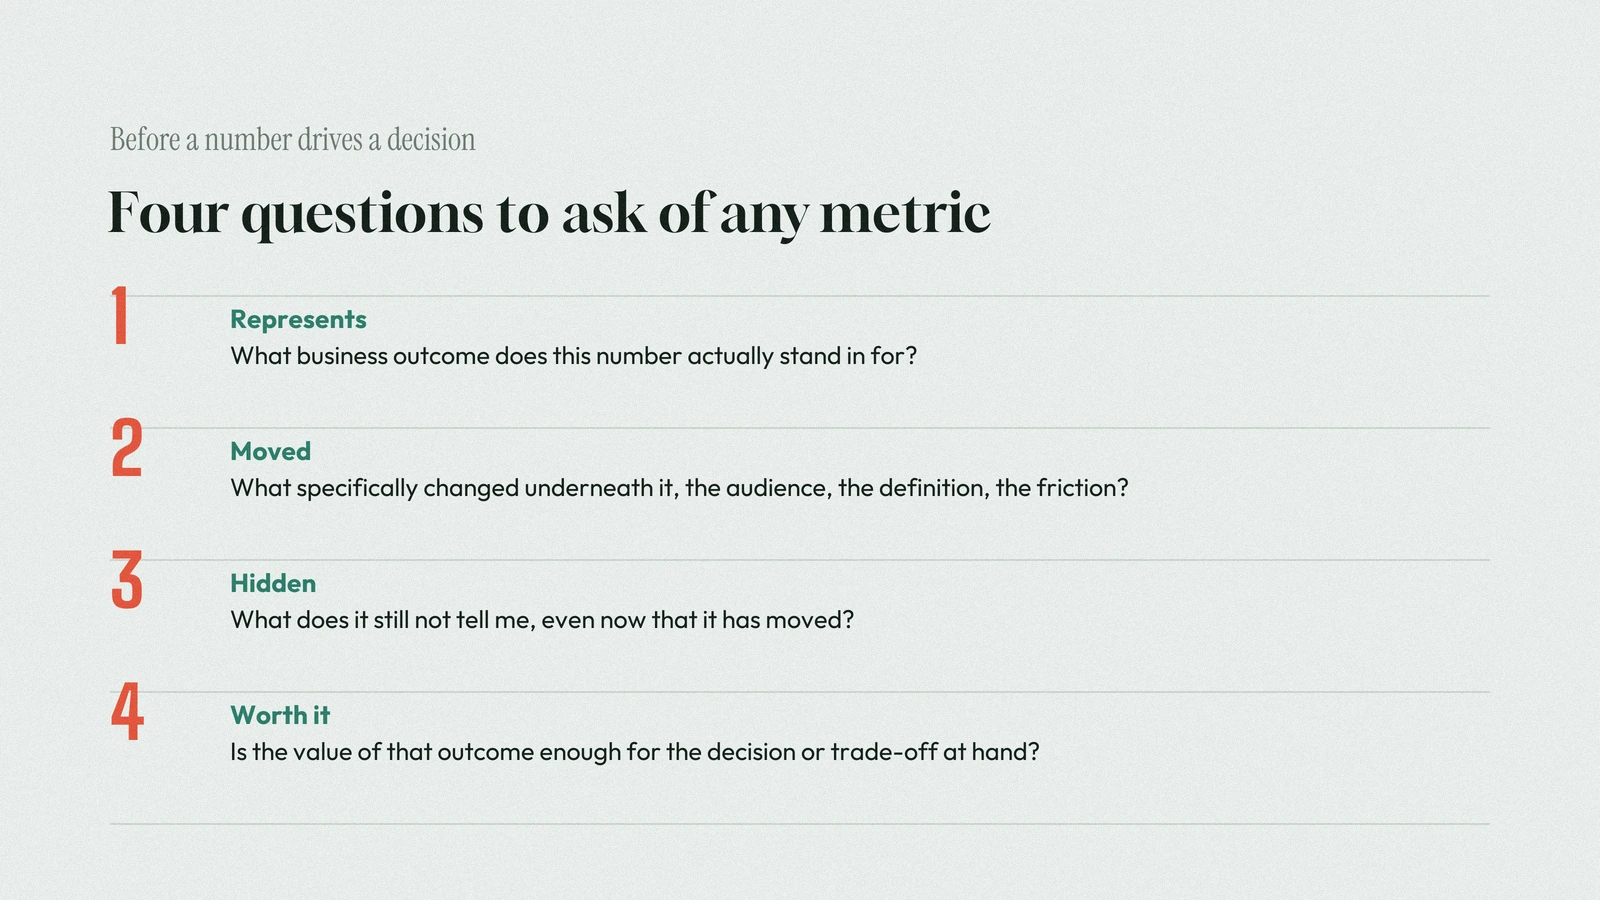
Before acting on a metric: what outcome does this represent, what changed to move it, what does it not tell me, and is the value of that outcome sufficient for the decision or trade-off being considered? Those questions won’t always change the decision. They will change the quality of the reasoning behind it.
Further reading: When metrics stabilize and performance stops moving in either direction, the diagnostic question shifts. If you’re deciding what to change at that point, our article Why Google Ads Performance Plateaus: Causes and Signals picks up where this leaves off.